sales
So you’ve got sales reports…Now what?

This post is authored by Dave Stachura, Accent's Director of Sales Enablement Consulting.
When I was getting started with enablement, our executive sponsor was very data-driven. In fact, the first time I heard the term was when he was describing himself. He wanted to see in-depth reports and dashboards on what we were doing, and I was happy to produce a whole presentation full of numbers and charts that showed off our efforts.
The charts were grade A awesome—the coolest looking ones I’d ever produced. I was so proud…until he took one look and said: “So what? What am I supposed to do with these? Is this good? Is enablement working? What should we be doing differently?”….Arrgh.
On that day, I learned a very common sales enablement mistake: I was thinking about sales enablement metrics the wrong way.
Analytics should be used to make decisions, not just to report on the past
The whole point of sales data collection should not be to make fancy reports, but rather to diagnose, predict and prescribe actions.
Shed light on sales situations
B2B sales can be a lot like landing a plane on a cloudy day. It may difficult for you to know exactly where you are and what you need to do to land the plane safely if you can’t always see the runway.

Using analytics is like transitioning from an outdated, simple cockpit to a modern one. You get a much more accurate picture of where you are and, more importantly, what you need to do to land the plane safely. Even the most skilled pilot will find it difficult to land in poor visibility without having instruments to help guide them, and even the most skilled sales person will have difficulty consistently closing complex deals without “instruments” to help them understand the sales situation.
Awareness is good. Action is better.
There are four main types of analytics for sales: descriptive, diagnostic, predictive and prescriptive.
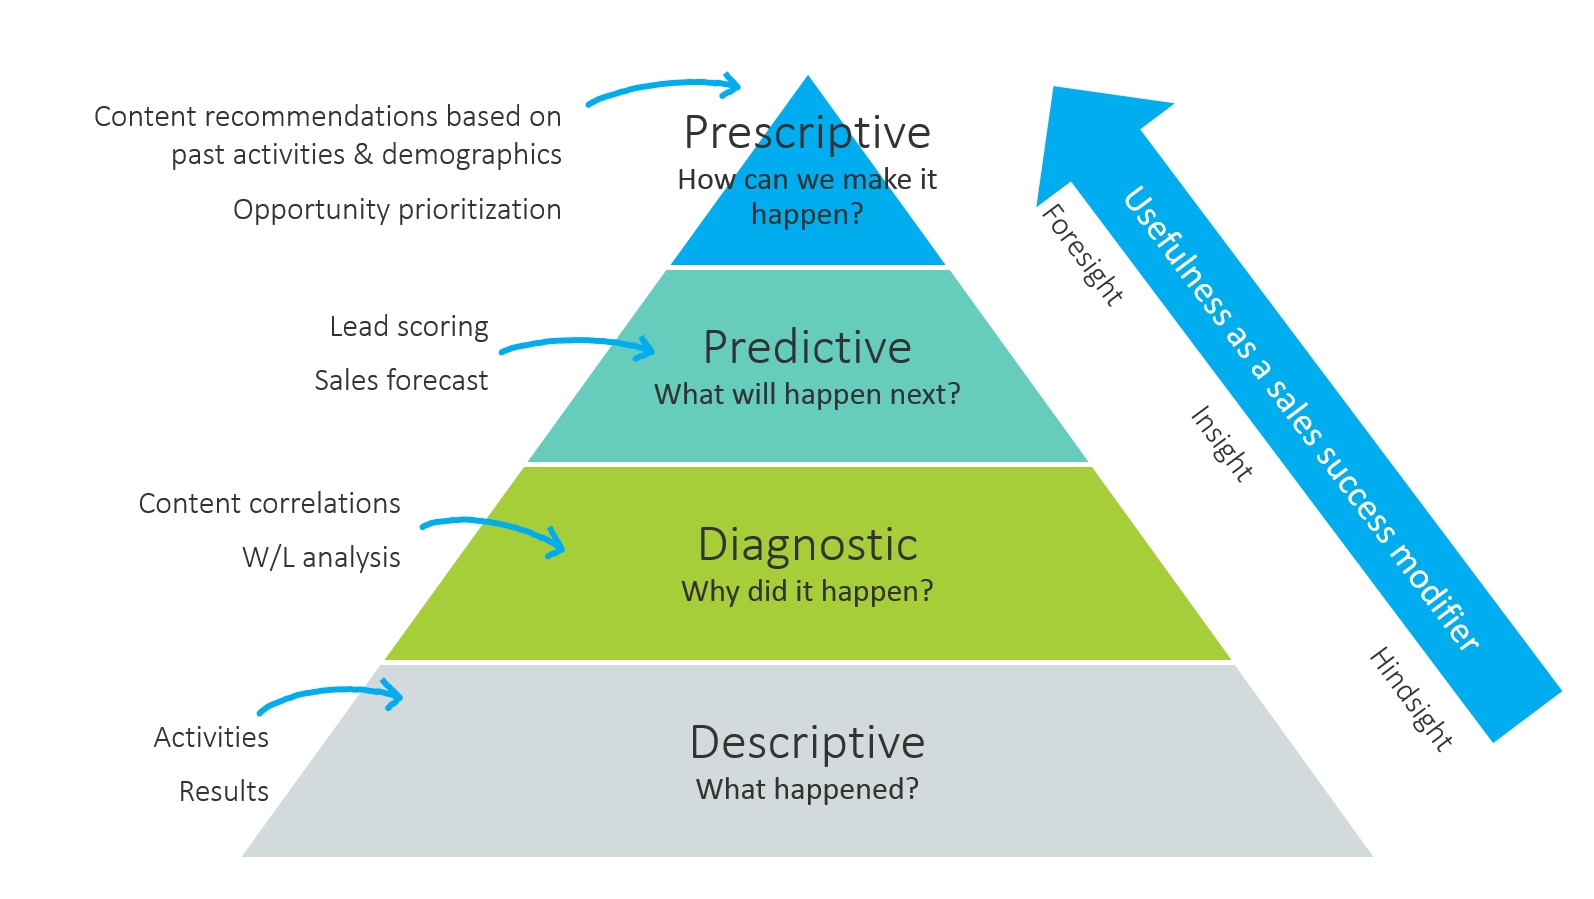
While descriptive, diagnostic and predictive analytics help shed light on a subject, prescriptive analytics give you a laser-like focus to answer specific questions or problems. It takes all of the data you’ve built up and uses it to identify what needs to be done in order to achieve a sales objective.
For example, analytics might use past communication cadence, buyer characteristics and past won deals to score opportunities by how likely they are to close. Then, analytics can take those high scoring leads and provide specific recommendations on how to get those leads to the finish line—send a specific presentation, call the buyer after a certain number of days, reach out to another member of the buying team, etc.
With the graph above, it’s worth noting that descriptive analytics shouldn’t be discounted as useless. Actually, descriptive analytics are essential, because everything builds with analytics. If you don’t do a good enough job of collecting and assessing your data, you won’t be able to draw meaningful insight from it.
Sales reports are as bad or good as you make them
Those sales reports I created for our executive sponsor displayed accurate and clearly defined information, but it was all hindsight. It didn’t give any insight into sales situations or guidance on improvements. That’s where I went wrong.
The data by itself is useless if you don’t do anything with it.
Make today the day that you start doing something with your sales data. The results will speak for themselves.
This topic was originally covered in Accent’s free webinar, “Sales Enablement vs. Sales Prevention: Which are You Doing?” The full webinar is available to watch on demand here.
By Accent Technologies
15th June 2016
Share